Pitching Forensics – The Doctor is in
So far using pitch f/x it’s been pretty easy to break down what is important for Dustin McGowan, Jesse Litsch, and A.J. Burnett to be effective. Compare a really good start to a really bad one and things pop out like how much a fastball is tailing, a curveball is curving, or a changeup is working.

The next thing I want to look at is what happened to Roy Halladay in May (other than the obvious- his appendix exploded). The Doctor was the best pitcher in the league in April, and from June 10th on had an excellent ERA of 3.32. But he pitched like a little-leaguer for three starts around the time that he went on the DL with acute appendicitis.
In the two starts before he had surgery, Halladay allowed 16 runs. He came back quickly from the DL and had one good start, but in his next one was absolutely shelled by Tampa Bay for 8 runs in 3 1/3 innings, the only time this season he did not go 5 innings. Roy said afterwards that it was a mechanical, not a physical problem, and he wasn’t getting on top of his pitches. Later it came out as Sal Fasano suggested a different grip (which Halladay later abandoned) that he was having trouble with his cutter. Let’s take a look at what was different in those three starts to make him so hittable.
April 13
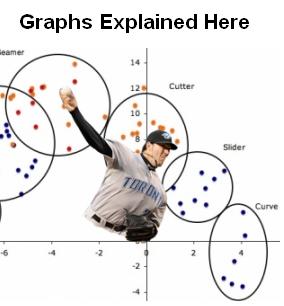
First, here’s the pitch movement in a good start by the doctor, from April 13. He went 10 innings to beat the Indians, allowing only 6 hits and one run – an absolute classic from the Jays ace on top of his game. Remember, this is pitch movement as compared to some mythical perfectly straight pitch. Those red dots on the left are diving, moving fastballs. Compare it to the movement of another pitcher to get an idea of how much- the scale is in inches.

This is what the “new” Halladay looks like, ever since he remade himself from a power pitcher into a ground ball pitcher. He doesn’t throw a big 12-6 breaking ball, just a little breaking pitch that is more like a slider. But his fastball sinks and tails away to a ridiculous degree- over 6 inches even when compared to McGowan and Burnett’s 2-seamers. Can you imagine trying to hit a 93 mph pitch that sinks and tails that much? And now here’s his location. Everything is low and he cuts his fastball in on the hands of left-handed batters.

May 5
Ok, enough drooling at Cy Young stuff. Here’s Roy’s first rocky start in May where he allowed 12 hits and 9 runs against the Texas Rangers.

Doesn’t look that bad, does it? All his pitches are sinking even more. There isn’t the same sort of crisp definition between his two fastballs, but his velocity and breaking ball is fine. And as you’ll see in a second, for the most part his location was there as well.
So what was different? Well, this game actually came down to one inning, the third. After a strong start, the Rangers strung together 8 hits and 6 runs. Then the Doc recovered and the only other runs credited to him were when Josh Towers allowed a couple of inherited runners to score. In the next graph you can see the pitches from the third inning with yellow dots inside them, and the pitches that went for hits are marked with X’s:

(You may notice that the scale is a little different- for the second time I used pitch “break” instead of movement. It’s very similar except it takes into account the “loop” of a pitch, which makes it a little easier to define breaking pitches and changeups).
As you can see, almost all of those pitches that blurred the line between the Doc’s two fastballs came in the third inning, and most of the hits that inning came off those pitches. So it looks like the Doc’s cut fastball deserted him for half an inning. Here’s his location with the 3rd inning pitches and hits marked. All the pitches from that inning were missing just off the inside corner, or were cutters that didn’t cut how he wanted them, ended up right over the plate, and were smacked for hits.

If you can stand looking at another graph about this start, you can see here that the Doc was right about what went wrong- his release point slipped down for that one inning.
May 10
Right before his Appendix Exploded, Halladay had a rough outing against the Red Sox. 5 innings, 11 hits- and again he had problems in the third inning, allowing 6 runs off 7 hits. Again, the problem was with his cut fastball, except this time in that inning it was cutting more than usual. I assume that he couldn’t control it, because all the hits came off his sinking fastball that Boston was sitting on. Again, the yellow dots are his trouble inning and the X’s are Boston hits. The final nail in the coffin was off a slider low but right down the middle (the blue + on both graphs).

And now his location, which wasn’t so bad, really: He was just facing a good hitting team and not hitting his spots dead on like he usually does. Amazing what a couple of inches can do to a pitcher’s plan.

June 15
The last blemish before being strong for the rest of the season came on June 5. After 7 shutout innings in his first start back, he was lit up by Tampa bay. There’s no secret what happened this start- too many pitches left up. On all of the Doc’s other starts, there are next to no balls in the upper half of the plate. Here is his location for that start and where Tampa got their hits (check out the Greg Norton single on a ball that was apparently a foot off the plate away from him).

Release point was the culprit for those pitches. It’s a little hard to see, but I’ve tried to show what happened to Hallday’s release point throughout the game in the next diagram. In the first two innings it was very consistent and centered. In the third and fourth, it started varying wildly- up to 3 inches to each side, down and up. And the only times that Halladay was able to go back to his old release point? They were those high pitches that were hit hard by Tampa. I know Doc’s too much of a warrior to admit anything was wrong physically, but I wouldn’t be surprised if this was the result of him rushing back and just running out of strength after a few innings so he ends up guiding the ball.
So there you have it- Halladay’s bumpy patch was caused by two different issues. First he had some problems with his cut fastball coming and going (while going up against two of the best offenses in the league- not a good combination) that lead to big innings. Then after being on the DL, he couldn’t keep a consistent release point and that led to him being unable to keep the ball down. Thankfully it only took him a few starts to self-diagnose himself, and for the rest of the year 2007 was another fantastic season for the doctor.


Awesome analysis! Thanks for all the hard work.
Dylan
October 16, 2007 at 6:56 pm
Thanks, this stuff is FUN. A couple clicks of the mouse and you can really get a sense of what’s happening out there. If there’s anything you want me to take a look at (a particular pitcher/pitch), let me know…
halejon
October 16, 2007 at 8:01 pm
[…] October 13, Jonathan Hale published “Pitching Forensics–The Doctor Is In“, an article examining characteristics of Roy Halladay’s rough patch in the first half […]
Enhanced Gameday analysis cataloged by date « Fast Balls
November 6, 2007 at 7:04 pm
[…] October 13, he published “Pitching Forensics–The Doctor Is In“, an article examining characteristics of Roy Halladay’s rough patch in the first half […]
Enhanced Gameday analysis cataloged by author « Fast Balls
December 10, 2007 at 4:24 pm
[…] October 13, Jonathan Hale published “Pitching Forensics–The Doctor Is In“, an article examining characteristics of Roy Halladay’s rough patch in the first half […]
Enhanced Gameday analysis cataloged by pitcher « Fast Balls
January 16, 2008 at 4:28 pm