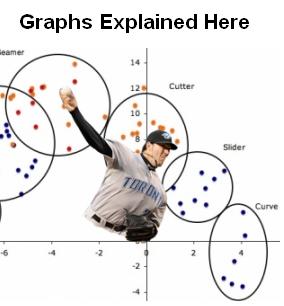
How the Blue Jays Changed David Price’s Cutter
Quick little rant to start this off: even with 3-D pitch data, analyzing pitchers is really hard. And your average stathead is really bad at it. The problem is that much more than hitters, pitching results have to be taken in context and results are based on a lot of luck and just as many moving and interrelated parts.
When a batter is 0-for-20 on inside fastballs or chasing breaking pitches in the dirt, you have come to some pretty reasonable conclusions immediately. Bat speed, not identifying pitches, etc. But when a pitcher’s fastballs start getting mashed, you have to start unpacking the whole chess match that is pitching to have any real idea why. Are they moving the same? Catching too much of the plate? Is the pitcher being too predictable or tipping his pitches? Throwing get-me-overs early, or nibbling until he has to groove one later on? Or is it something completely different, like a loss of similar-looking offspeed stuff or overall command so that batters are able to look for that one pitch or location? Combine these sorts of questions with the huge variation in pitcher stuff from one game to the next and you usually end up with a bunch of plausible explanations and no clear picture. And yet…”BATTING AVERAGE VS FASTBALLS” (or even something supposedly SABR like “Miss%”) graphs are everywhere…look at those numbers go up! That guy should stop throwing fastballs! Or throw better ones! Or something!
Anyway…my thinking these days is you may as well just point at the smoking gun, the one undeniably eye-popping thing that pops out as different at the same time that a pitcher is going wrong, and we can all draw our own plausible narratives for what it means — because without first-hand information, who really knows. Which brings me to David Price, and the search for an explanation other than the “DUDE HAS NO CLUTCH” or “IT WAS ALL THAT ONE POPUP BROKE HIS BRAIN DAMN YOU GOINS” nonsense we’ll be hearing for months no matter how the postseason turns out.
Cue the context: in his maturity, Price has started throwing his Changeup more and more, and his Curveball less and less, and as a result has morphed from a more typical southpaw into a righty killer. But it’s not just an Estradaesque Change — Price also plays a delicious little game on the outside edge of the zone with his sinker, straight fastball and cut-fastball.
See, most power lefties use their cutters like Jon Lester — in on the hands exclusively:
***DISCLAIMER*** My pitch f/x database is not current so from here on in, I’m ripping from www.brooksbaseball.net. You should go there and mess around with this stuff on your own, thus rendering me obsolete. These strike zone heat maps are from the catcher’s perspective.

It’s a nasty pitch, and a great little plan B. Either it’s a ball inside and the batter misses it like a back-foot slider, or else it’s an inside cutter slicing across the plate that they make terrible, sawed-off contact against. But Price hasn’t worked like that for some time. Here are his cutters to right-handed batters from the start of 2014 up to the point where the Jays acquired him.

He sometimes comes down and in, but much prefers to “back-door” right-handed batters with his cutter, which makes great sense considering his repertoire and fastball command. With two strikes, a batter might very well see a 4-seam pinpoint-command-type fastball on the outer edge, a 2-seamer sinking and moving away, or a cutter that starts outside and darts back over at the last minute. Got all that in your head? Well, that’s probably why you bit early and chased the changeup…It’s interesting watching Price on a start-to-start basis; I was expecting a lot more heat and devastating movement and saw a lot more guys swinging at full-count 2-seamers half a foot off the plate or taking cutters that were clearly strikes than I expected (for this reason).
But the thing is…after a month of transition, the Jays completely turned his cutter usage inside-out. Here he is in September, throwing it much like Lester. There are still a handful on the outer third, but it’s now usually inside. And this is not a small sample size or matter of the batters he faced — I mean, double the numbers you see down and in for this month and you’ve got at the number of cutters Price threw there for almost two seasons leading up to this September.

By his last (terrible) start against the Rays Price simply was no longer an back-door cutter thrower.
In addition to the change in strategy, you also have to wonder about the strain on Price’s arm. The cutter has a bad reputation for arm health, and here’s how throwing it to both sides of the plate increased the load:

That’s since 2013, and keep in mind the last three data points are playoffs — the Jays ramped up his cutter usage to an unprecedented 40% of his pitches towards the end of the year. Brooks is also missing data for one start against the Braves in which Price threw 33% cutters, which makes the late season cutterfest look even more intense.
And, although the trend had already started when they acquired him, these cutters were hard, 91-92 mph ones in on the hands and not the back-door 88-89 variety he had been throwing.

So now we have see a very different Price in the postseason…in addition to all the ‘lack of command’, one of his main weapons (and you might even say a key part of his established strategy against RHB) was no longer present. The anti-clutch postseason David Price no longer throws a precision back-door cutter to RHB, he throws one in on the hands or floats it over the middle:

Interestingly, in his last game against KC, Price threw 11 cutters all game and then 6 in the final disastrous frame. Seems like a coincidence, though (unless we’re going to really reach for the idea that overthrowing it caused him to lose his command of his ‘feel’ pitches) as his dominance in the game was due to low changeups and impeccable fastball command, and they got their hits off of low and away changeups to LHB (which he never throws intentionally) and fastballs that caught too much of the plate.
Anyway, the burning questions for me here are:
1) The Jays completely changed one of Price’s weapons down the stretch. Did they tinker with and ultimately mess up Cy Young stuff out of fear of the lefty-heavy Yankees lineup?
2) The Jays ran their rental pitcher cutter-hard down the stretch. Is some sort of dead arm why they gave him an unusual 11-game break at the end, and why he was not saved for game 5 of the ALDS?
3) Will Price shed his nice-guy attitude, shake off a bunch of pitches, and throw his normal game if the Jays need him again after the embarrassing and free-agent-cash-destroying debacle that has been his postseason so far???
More on the Wind vs. Dickey’s Knuckleball
One more thing to add about the effect of a closed dome — there is another variable used to describe movement in pitch f/x, called “break length”, which is defined as:
“…the greatest distance between the trajectory of the pitch at any point between the release point and the front of home plate, and the straight line path from the release point and the front of home plate.”
Here is a graphic ripped off from a John Walsh article showing what that means:

Basically, if you threw a curveball that instead of travelling in a perfectly straight line from your hand to the catcher’s glove, went ten feet up and then back down into the mitt, the break length of that pitch would be 10 feet. It doesn’t matter if it breaks down or sideways, just how “loopy”, or “bendy” the breaking pitch is. I rarely end up using this number, because I’m never sure if that’s a good thing or not. In the case of sliders, it’s a bad thing: you want a tight slider that looks like a fastball until the last minute. In the case of most curves, it’s a good thing: the more knee-buckling, the better.
You have to just ignore the early spikes on these graphs because it’s based on a super-small sample size of a single game at 1 and 3 mph, but if we compare wind magnitude (mph) to break length (inches), there is a clear and sustained connection between the ‘loopiness’ of Dickey’s knuckler and how hard the wind is blowing:

That’s what you might expect from a pitch that is dependent on interacting with air currents for its movement, but for some reason it also leads to batters taking more cuts:

And especially in very windy conditions, getting way more hits:

Again, each knuckleball is so random it’s mostly speculation exactly what is making them more appealing to swing at and easier to get a hit off, but this is another indication that a closed dome really helps R.A. — if only to escape the nightmare of a stiff breeze. Perhaps, as has driven the modern trend away from big breaking balls to splitters and cutters (and Dickey’s Cy Young season being due to a harder knuckler with less movement on it) pitches that break a lot are impressive, but not as effective against major-leaguers as those that seem to be hittable and then dart away at the last moment.
Does closing the dome help R.A. Dickey’s Knuckleball?
There was a lot of speculation last year about the effect of the dome on R.A. Dickey’s knuckleball, to the point where the dome was closed on a perfectly lovely fall day for his last start after Dickey made some noise in the media about wanting it that way. While Dickey seems like a guy who is exceptionally in touch with his craft, and a quick look at his numbers seems to support the idea, Alex Anthopolous is right to grumble about sample size and Dickey’s early-season injury making ERA comparisons questionable at best — especially since a major fight with the MLB is looming if the Jays start closing the dome next year on sunny days in June.
It has been rumoured that knuckleballers thrive in domes since the days of Wakefield crushing the Jays, but the details have always been vague. I’ve heard humidity and the wind raised as possible factors, but never a clear explanation of why, or whether the pitch is more controllable, less predictable, or has more movement on it inside a dome. Fortunately, pitch f/x records whether the roof was open or closed, as well as the wind and direction, so it’s possible to drill down and look at the results of individual pitches to investigate some of the theories floating around.
Theory 1: R.A. Dickey has better control over his knuckleball when the dome is closed.
Sounds plausible — if the knuckleball wasn’t quite so impossible to control it would be the best pitch ever, so maybe in calmer air the pitch is not quite as difficult to get over the plate. As Tom Candiotti said:
“It’s really a great place to pitch,” former Major Leaguer Tom Candiotti said of Rogers Centre. “I pitched with the roof open, I pitched with the roof closed, and I always preferred the movement of the ball and the consistency of the movement with the roof closed because it was the same every inning.”
However, there was absolutely no difference last year in the percentage of knuckleballs that ended up crossing the plate in the strike zone with the roof open compared to closed:
| Dickey’s Knuckleball Accuracy | |
| Conditions | In zone % |
| 2011 | 49 |
| 2012 | 50 |
| 2013 – Away Games | 48 |
| 2013 – Dome Open | 49 |
| 2013 – Dome Closed | 49 |
For most pitchers, this would not be enough to close the book on ‘control’– you really need to get into how close to the edges of the strike zone, or the spots that the pitcher is actually aiming for. But even Dickey acknowledges that at most he is starting his knuckler in slightly different regions of the strike zone and then letting the pitch do its random thing from there. You’d have a hard time convincing me that Dickey is somehow ‘hitting his spots’ within the strike zone better due to a more consistent knuckleball, but not throwing any more pitches in the zone overall.
Verdict: Busted.
Theory 2: Dickey’s Knuckleball is harder to hit with the roof closed.
So if the movement isn’t more consistent, is it just plain nastier? I think misses per swing (with fouls taken out of the equation since there is no way to differentiate between a foul tip and a 400-foot drive that hooked just foul) is the best measure of how difficult it is to make contact with an offspeed pitch. Yes, deception is important, and getting hitters to chase pitches out of the strike zone can be as effective as throwing a pitch with incredible movement. But it all balances out very well into one number — if a major league hitter decides to swing at an offspeed pitch and comes up completely empty, that pitch had quality movement, whether it was down the middle or bounced in the dirt. And Dickey generated more misses with the dome closed last year:
| Dickey’s Knuckleball | |
| Year/Conditions | Miss/Swing % |
| 2011 | 30 |
| 2012 | 41 |
| 2013 – Away Games | 40 |
| 2013 – Dome Open | 32 |
| 2013 – Dome Closed | 38 |
Interesting, but a difference of 6% is not that significant, and Dickey’s numbers were just as good on the road in 2013. However, if we’re talking about swings and misses, remember that Dickey throws two hard knuckleballs (in addition to his 65 mph floater), one in the low 70’s and one in the high 70’s that he tends to use as a strikeout pitch. As I showed before last season started, it was throwing so many more of the high-70’s knuckler that made his strikeout rate go through the roof last year, and while pitching through injury early in the season, that pitch was largely missing from his repertoire. So here are his swing-and-miss numbers for Dickey’s knucklers that were thrown faster than 76 mph:
| Dickey’s knuckleballs > 76.0 mph | ||
| Year/Conditions | In Zone % | Miss/Swing % |
| 2011 | 49 | 30 |
| 2012 | 49 | 42 |
| 2013 – Away Games | 43 | 31 |
| 2013 – Dome Open | 47 | 33 |
| 2013 – Dome Closed | 53 | 48 |
Now that’s something. It might not seem like it, but a 15% difference in miss rate is a TON. For example, the average miss rate for curveballs last year in the majors was 35.5%. The best curveball in the league (over 200 thrown) was 52%. So the difference in terms of swing-and-misses for Dickey’s hard knuckler with the dome closed compared to either being on the road, or with the dome open, was just about the same as between a run-of-the-mill curveball and the best one in the league.
Verdict: Very much so.
Ok, but why? Swings and misses are a lot better than ERA, but results are never quite enough to be totally sure — maybe he was more effective at home for other reasons like the mound, the home crowd, or he just happened to be facing poorer teams (correlation does not imply causation, for the statheads out there). But if there is proof of his knuckleball moving in a fundamentally different way under dome-closed conditions, that’s much more compelling and puts to rest any doubts remaining about the sample size or other factors.
So now let’s look at the average movement under different wind conditions, compared to those inside the dome. Pitch f/x movement is always measured in comparison to a spinless pitch, so the average for a knuckleball averages around 0 for both x (horizontal movement in inches, with positive values representing movement towards a left-handed batter) and y (vertical movement), since the random movement in all directions that the knuckleball takes on from there cancels out.
(Keep in mind that this is simply a measure of where the pitches tend to end up crossing the plate compared to where they would have if nothing was happening at all. This doesn’t have anything to say about when or how they flutter on the way to the plate.)
| Effect of wind on Knuckleball movement and results | ||||
| Wind | PFX | PFZ | In Zone % | Miss % |
| None (Dome) | 1.18 | 1.61 | 0.49 | 0.39 |
| Right to Left | 0.05 | 0.03 | 0.50 | 0.30 |
| Left to Right | -0.26 | 0.57 | 0.49 | 0.33 |
| In | 0.17 | 1.27 | 0.48 | 0.37 |
| Out | 0.20 |
0.32 |
0.50 |
0.33 |
So while a crosswind seems to have no particular (at least consistent) effect, on average Dickey’s knuckleball is more likely to have almost two inches more of up-and-away movement with the dome closed than in other wind conditions (the results are even more compelling if we only look at Dickey’s 76+ mph knuckleballs again: [pfx: -0.24 pfz: 1.35 with the dome open vs. pfx: 0.80 pfz: 2.15 with it closed]. As I showed in a previous article, that direction of movement is by far the most deadly: “Hitters swing through them almost twice as often as ones that sink down and in, and get fewer hits when they do make contact.”
There may be other reasons, but that makes sense considering that it’s a type of movement that is not seen in any other pitch. Sometimes Dickey’s knuckleball ends up having similar action to a changeup, or a slider, or even a rising fastball. But no other pitch in the world moves in that direction (Mariano Rivera’s cutter came the closest)
Theory 3: Higher humidity (with the dome closed) is good for the knuckleball.
Dickey has mentioned humidity as a factor several times, and In an interview with Michael Morrissey, Dickey gives his theory on how it helps the knuckle:
As expected, Dickey noted that domes and places with high humidity are good environments for his knuckleball. Domes are good because of the lack of wind. High humidity is good because “the seams grip the air better.”
But then in another interview, Dickey seems to suggest that it has an adverse effect (although he could be referring to overly humid conditions making it hard for him to get the proper grip, as most pitchers see their K rates drop at very high temperatures, most likely due to sweat):
Yes, a controlled climate is (desirable) and a dome offers you that,” Dickey said. “But if it’s been open all day and then it’s closed at game time, all that humidity (gets) stuck there and that’s not good (for a knuckleball).”
Anyway, humid air is actually less dense than normal air (seems backwards but is true), so I don’t buy the idea that it would grip the seams more. And if anything, less drag should make the knuckleball have less movement (imagine pushing a beachball through water compared to air). But another thing that would cause less resistance on the ball is having the wind at Dickey’s back — which is the other number that pops out from the above movement table as causing Dickey’s knuckleball to rise. (Wind “in” on the above table, which is a combination of in from right, left, and centre field — if we isolate down to wind coming straight in from CF, pfz rises even higher to 2.16).
This supports the idea that higher humidity inside the dome makes Dickey’s knuckleball rise and become harder to hit, in much the same way that wind at his back does — but there’s something else with the dome closed that gives it sideways movement as well, away from right-handed batters. Or that’s my theory, anyway — for a much more rigorous look at the physics behind what makes the knuckleball do its thing, check out Alan Nathan’s site.
Verdict: Highly probable, but best left to real physicists.
In conclusion:
- While it might have some kind of subtle effect, Dickey’s knuckleball is not more ‘accurate’ in any meaningful way with the roof closed.
- Dickey’s knuckleball gets far more swings and misses when it rises/floats, especially up and away from right-handed batters.
- He can throw it harder to make that happen but also gets more lift if he has the wind at his back, and more lift + movement away from right-handed batters with the roof closed.
- The effect is much more pronounced on Dickey’s upper-70’s knuckleball than his lower-70’s offering, or his 65mph floater.
- The results are significant enough that if Dickey was starting for the Jays in a critical game there is a strong argument to be made in favour of closing the dome. (Or maybe a humidifier promotion? Hand fans for everyone in centre field? Starting the “hurricane” instead of the “wave”? The possibilities are endless…)
But they were OUR Mercenary Juicers!
It’s mostly just Richard Griffin twisting his words into something bigger than they are, but the talk about how the Steroid Era hurt him and the Blue Jays is all rather rich coming from Pat Hentgen:
“When I look back on it, no question about it, I definitely gave up more runs, I definitely feel like it cost me more earned runs and it cost our team more runs because of it.”
In 1998, Pat Hentgen had the worst full season of his career (5.17 ERA), but still won 12 games — helped in no small part by one of the greatest achievements in juicing of all time: a 33-year-old Jose Canseco hitting 46 home runs as a member of the Blue Jays. It’s hard to imagine how any other team could have been helped more by Steroids that season, especially considering the Jays’ ace was Roger Clemens in his juicing prime.
Without ‘roiders, the Jays’ would not have been in the race, would not have won the most games of any Jays’ team since winning the World Series, and Hentgen would not have had a winning record. Other than the pure satisfaction of winning, it’s not a stretch to say that being on a team that was juiced to the gills prolonged Hentgen’s career and got him more money at contract time despite his best days being behind him.
I like Pat Hentgen, and I certainly am not suggesting that he should have taken on the era single-handedly. But when you play alongside and reap the rewards of two of the most obviously guilty and highly successful juicers of all time, and in your own words “just blend in and go with the flow”, you’ve lost all right to complain or take the moral high ground years later. The Jays’ history is just as dirty as any team’s, if not more, and any attempt to rewrite our dirty history is nauseating — even a little laughable after so enthusiastically embracing Melky Cabrera.
How To Destroy Perfectly Good Pitch f/x Data
Sometimes you have to step back and think about what the data you’re crunching really means. Shi Davidi’s latest piece using pitch f/x comes to the conclusion that pitchers are “getting the calls” because more balls in the zone are called strikes than the other way around. But let’s think about that for a millisecond, shall we?
There’s an area around on the fringe of the strike zone where blown calls get made. Every strike is by definition no more than 10 inches away from that danger zone (because it’s somewhere in the zone) while balls can be anywhere — bounced, two feet outside. If there a super simple call to be made, it was a ball.
So by using the overall number of balls and strikes (instead of, say, only pitches within 3 inches of the border) that includes all pitches close and not to find a percentage of incorrect calls, all this “study” has really proven is that strikes are more likely to be blown calls, which is something logically obvious and not stunning at all. If you actually do the hard work and concentrate only on fringe pitches (or something — the classic John Walsh article at the Hardball Times graphed the overall % of pitches called strikes and vice versa by inches from the plate to find where they crossed on both planes), you find the real zone is slightly larger than the rulebook zone, and hitters generally get the shaft a little. Just like everybody thought. Shi, you’ve got a bunch of major-leaguers to go back to and unconfuse (while pleading they give the new technology another chance, please).
The one interesting thing to be gleaned from this outrageous mess is a corroboration that the corners are generally clipped — mid/away is where all the “called strikes out of the strike zone” (I would call them “extra strikes”) are, and down and away are where most of the extra balls are. But then Shi ignores that fact when coming to the rest of his conclusions:
Mauer, in fact, gets the fifth fewest ball calls on pitches in the zone at 11.96 per cent. Oddly, Blue Jays slugger Adam Lind, widely credited for his discipline this season, gets the least calls in this category at 10.24 per cent.
What about their drastically different swing rates? What this actually reflects is how many close strikes on the corners a hitter takes (since that’s almost exclusively where ‘extra balls’ come from, as shown by Shi’s own charts). Lind may have been credited with taking more walks this year, but his discipline hasn’t improved much — so he fouls off or puts in play balls placed right on the corner where umps are more likely to not call them, and doesn’t get as many of them to begin with as a player of Mauer’s calibre. Trying to guess how he is being treated by the umps without considering the flip side (how many strikes out of the zone are called on him — could be just as low), or how often he swings the bat, is pointless.
Janssen’s percentage of pitches in the strike zone called for balls is 10.9 per cent, nearly half the big-league average, while his ratio for strikes outside the zone is 15.4 percent, more than double the average.
In much the same way, you have to consider at where these pitches are, instead of assuming that you can lump them together and the distribution is average. That’s not a sign that the umpires are giving him calls, it’s a sign of where Janssen is throwing the ball — he mixes his straight fastball and cutter at the belt and just on or off the plate instead of purely hunting for the corners with sliders, etc. It’s a great approach because it takes advantage of where umpires give the calls — but we’ve got a chicken and egg thing going here. Casey gets better calls because he knows (or his natural approach has blundered across) where to go for them — they aren’t given to him because the umpires respect him.
It goes on and on…one blatant misinterpretation to fit the pre-existing narrative after the other. I know I sound like a statistical crank here, but sometimes you gotta question if the first thing that pops into your mind that makes for a great story is right, or if something else could be causing the phenomenon. I cannot tell you how hair it makes me lose to listen to Zaun completely dismiss the system and it’s “laser-guided gizmos” because the dome vibrates when it gets loud, and then watch Shi absolutely brutalize the data like this. Way to make science look stupid, guys. It’s not.
(Incidentally, the one issue that almost gets a complete pass here is that the strike zone is of course three-dimensional, while the graphic you see on TV is just the front edge. Apparently before giving the results back to the umpires, MLB cleans up the technically-should-be-strikes that just clip the edges/corners of the zone because everyone knows they never really called. On the flip side, there are clearly some pitches that cross the front of the plate just off that curve or tail to clip the back and should rightly be called strikes. That’s what Zaun should be grumbling about.)
A Quick Fix for JP Arencibia’s OBP
Some players simply will never have the ability to recognize and lay off tough pitches that start in the zone and wind out of it. I get that. It is entirely possible to have a reasonable career that is based on hitting first pitches and mistakes very, very, far, and accepting that once you get behind in the count it’s going to take a miracle to get on base.
But other times, the balance between taking strikes and chasing balls becomes so lopsided that opposing pitchers can adjust their entire pitching strategy to take advantage of a player. Without the fear of a potential walk, there isn’t the same need to get ahead with the first pitch, or ‘give in’ in a hitter’s count with a fastball, and a hitter just stops getting reasonable pitches to hit, ever. In the same way that it pays sometimes to bunt or else the opposition will play way back on the grass and gain more than you lose by bunting, sometimes you just have to take a close pitch that might very well be a strike just so the league knows you’re capable of it.
Case in point: J.P. Arencibia. On 3-2 counts, most hitters are going to see somewhat more strikes with the threat of a walk looming. But now that every scouting report on him is just a giant yellow highlighter down his walk, swing, and miss rates, only 46 percent of full-count pitches have been in the strike zone (down from 55% last year — and not surprisingly, he’s missing them at 48%, up from 32%). Which brings to mind a novel way to “make the adjustment” back at the league: never, ever, swing with the count full.
Using his current strategy of “attempting to use his baseball skills to avoid striking out” in full counts, JP has struck out 19 times and walked 6. He also has three singles and two doubles. If he was instead using the revolutionary approach of “keeping the bat on your damn shoulder at all times”, of the 46 pitches he saw in those counts, 21 were in the zone and 25 of them were out. So, if we forget that some of those pitches happened in the same at-bats due to foul balls:
Using skills to reach base: 19 strikeouts, six walks, 10 outs in play, three singles and two doubles, vs:
Doing absolutely nothing: 21 strikeouts, 25 walks, zero balls in play.
OF COURSE THIS IS AN ABSURD SUGGESTION. But no more than the fact that not using his bat in full count situations would not seriously affect how often Arencibia strikes out on 3-2, and that somehow convincing the league that he was in the batter’s box ready to do his thing when he was actually watching the payoff pitch from his usual position crouched behind the plate would more than double his walk rate overall. His average would fall from .218 to .215, but his OBP would soar from the current league-worst .253 up to .295. And with JP’s pop, that’s a major-league catcher!
The Jay Land
The Jay Land (With apologies to T.S. Eliot)
APRIL is the cruellest month, losing
Games out on the cold land, freezing
Ligaments and desire, whiffing
Dead bats causing spring pain.
Winter kept us warm, covering
T.O. in forgetful snow, feeding
Too much hope with press releases.
The offseason surprised us, coming towards the ‘dome
With a shower of money; we stopped in the blizzards,
And went on in sunlight, into the beer garden,
And drank pitchers, and talked for hours.
Buehrle, Johnson, Reyes, Dickey, Cabrera, it is done!
And when we were children, listening on the radio,
My friend’s, he took me out for some hacks,
And I was terrible. He said, Jon,
Jon, swing more softly. And out it went.
In the fields, there you feel free.
I read, much of the season, and go to Cuba in the winter.
Softer, Worse, Slower
A quick post-mortem (literally) on Dickey’s start last night…remember from last post how sitting consistently around 79 mph was one of the keys to his Cy? Here’s a graph of his velocity (all types of pitches) from one of his stellar starts – a 12K one-hitter against the Rays as an example of how he’s throwing when at his best. Except for fastballs and at the very end of the game, Dickey threw over 80% of his knucklers in the 78-80 mph range back then:
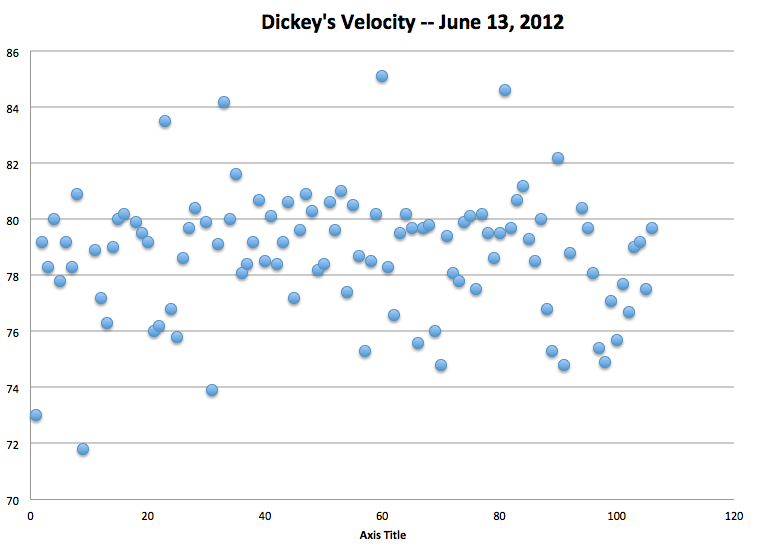
And now here’s the same thing for him last night:
 Not so much. It’s hard to tell, but it almost looks like he’s gone back to the ‘slower’ version of his knuckler that he for the most part ditched last season. Dickey also threw more fastballs than usual, including two that left the yard off the bat of Will Middlebrooks. The first time, Dickey seemed frustrated after allowing 4 consecutive hits to start the game, and put it on a tee for him on the first pitch — perfectly down the middle, straight as a board, letter high, 84 mph. Surprise value kinda goes out the window when you throw a meatball like that.
The second time, Dickey fell behind 3-0 on knuckleballs and then threw three fastballs in a row: 1) Called strike, 2) swinging strike 3) giant bomb on exactly the same pitch as in the first inning. I kind of get it if Dickey wasn’t feeling the knuckleball anyway, but seems like an odd call. Middlebrooks, again, was not so surprised.
Incidentally, I was in the first row behind the VIP section for that debacle (the best seat I have ever had and most likely ever will) and Dickey’s knuckle looked awesome as he warmed up between innings. He threw a half-dozen wicked darters for strikes that made me gasp, but once the cameras were on seemed to have trouble finding the plate with anything other than the slower, tumbling variety.
Dickey’s Knuckler — Harder, Better, Faster
To make a long story short, as soon as R.A. Dickey was acquired this offseason I set off to write the definitive work on why he was so great last year and what to expect in this one, and completely and utterly failed. It turns out quantifying and/or predicting the evolution of that damn pitch is just about as hard as hitting, calling, or catching it…I mean, let’s face it — the man has discovered a pitch that nobody has ever thrown before which makes him great at an age that nobody has ever become great. There is simply no comparison, no career arc, no regression to the freaking mean. And if you saw any of his shutouts last year, it was clearly not a sample size or once-around-the-league-with-a-new-pitch type of thing.
Ah well…not that anybody made any solid predictions as to where his numbers were going to wind up this year on the spectrum running from a) pretty decent as he has been for most of his late career through b) Cy Young winner as he was last season, all the way over to c) best-ever-what-the-heck-is-even-going-on-who-gave-this-guy-the-cheat-codes-to-baseball that he was for about a month in June.
And I did make some pretty graphs as I floundered about. Here’s a nice one, about the speed of his knucklers last year (red) compared to his previous seasons (blue):

Averages can be misleading…Dickey actually threw fewer knucklers over 80 mph last season than in the previous two — but he used to throw two slightly different knucklers, one in the low 70’s, and one in the high, and then started to favour his harder one heavily last year. Here it also looks like he managed to bunch up his fast knuckler at the top of his range (without overthrowing it) much more often as well.
Annnnd this next one might shed some light on why that is the case:
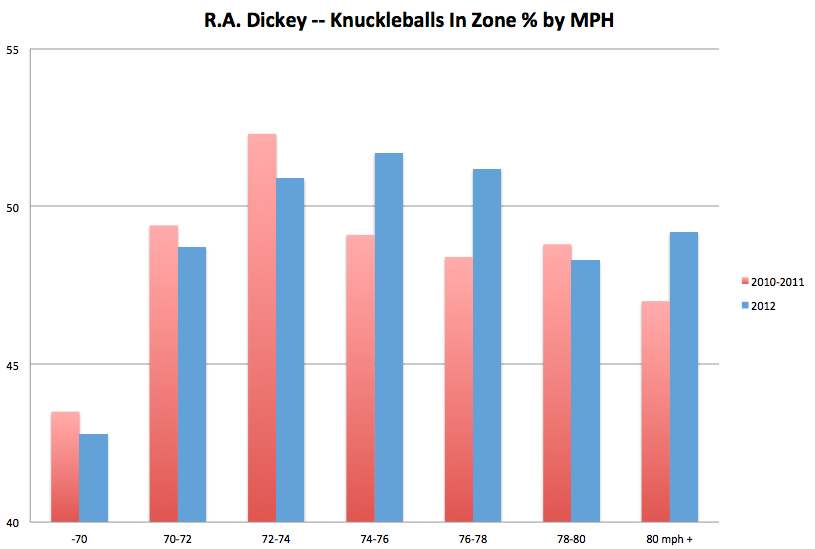
There’s probably a better way to show this than bar graphs, but before last year, Dickey could only get his slower knuckle over the plate for strikes consistently. 50% is kind of a magic number for me in terms of first pitch strikes, fastball strike %, etc…anything below it is either trouble or a chase pitch. The fact that Dickey was able last year to throw his 74-78 mph knucklers in the zone more often than not has to have been a huge factor in his instant success — it makes his strikeout pitch the same as his get-me-over pitch. And even when it wasn’t over the plate it was getting more strikes — it’s no big surprise that hitters miss Dickey’s knuckler more the faster it is — but they also swing at it more often.
 It’s simply a much better pitch at the higher velocities…more swings, more misses, more chases, only slightly less often in the zone.
| Speed | In Zone % | Swing | Miss % | Chase % |
| Under 75 mph | 53 | 25 | 40 | 15 |
| 75-80 | 49 | 34 | 39 | 21 |
| 80+ | 49 | 39 | 53 | 27 |
Now here’s where I got kind of lost…Dickey throws harder knucklers on 0-2, 1-2 counts, and although side-to-side movement on a knuckler is basically random, his harder ones do tend to stay ‘up’ more. Here is a chart of movement, with pfx from side to side and pfz the vertical ‘rise’ on his knucklers compared to gravity.
| Speed | Pfx | pfz |
| Under 75 mph | -1.03 | -0.26 |
| 75-80 | 0.34 | 1.00 |
| 80+ | 0.36 | 2.54 |
So while the movement on his pitches is random, you could say that R.A. has some control over his knuckler in that he locates with softer ones and then puts hitters away with his hard ones — but last year, he just threw them all hard and in the zone and was incredibly effective as a result.
Also, Dickey’s knucklers that veer up and away from right-handed batters are by far his most effective – not entirely surprising, since that is the the only pitch movement that is totally unique, and not replicating the general movement of either a curve/slider (down and away), changeup/2-seamer (down and it) or 4-seamer (‘up’ and in). The only other pitch that sort of does that is Mariano Rivera’s cutter, or the Doc’s at his best — they travel almost exactly side to side instead of like a semi-slider.
| R.A. Dickey Knucklers by direction | |||||
| Dominant Movement | In Zone % | Miss % | Swing % | Strike % | Hit % |
| Up left (into RHB) | 0.50 | 0.33 | 0.30 | 0.43 | 0.0600 |
| Up right (away from RHB) | 0.47 | 0.49 | 0.29 | 0.49 | 0.0427 |
| Down left | 0.47 | 0.26 | 0.32 | 0.38 | 0.0747 |
| Down right | 0.54 | 0.29 | 0.34 | 0.44 | 0.0646 |
Hitters swing through them almost twice as often as ones that sink down and in, and get fewer hits when they do make contact. Especially from the television perspective, it’s a strange thing to get used to — his best pitches are the ones that stay up and over the plate, which for most other pitches is a sign of a mistake. Coming off a start where he didn’t have the greatest control it will be interesting to see if he goes back to his slower knuckler to try to get more strikes until he can consistently locate the hard one that won him the Cy.
Last Post About BABIP Ever I Swear To God
Seeing that I don’t even have the time to wrap up the rather interesting stuff that I’ve been working on for months, I think this blog is just going to become a depository for completely ridiculous statistical statements this season, as was its original intention. So here weeee goooooo! Arash Madani, are you freaking kidding me?
Anthony Gose’s ascension to the big-leagues was fast. His progress in the show –15 stolen bases and a batting average of .340 with balls in play through 56 games with Toronto last season — was encouraging.
As I’ve ranted, BABIP is interesting for pitchers, and almost completely useless and/or misleading for everyone else. Having a high BABIP is equally likely due to a low contact rate (or luck — HR hurt it, too). If you take huge cuts and strike out instead of making weak contact on every 2 strike count, congrats! Your BABIP goes up! (Isn’t this just a terrific modern stat?) Obviously Madani trying to imply that this means Gose’s speed means he often reaches base when he does put the ball in play, but the real reason is that if Gose’s AB were extrapolated over an entire season, he would have struck out the 5th most times in major-league history (with only Adam Dunn and Mark Reynolds above him). Ummm, yeah…that’s highly encouraging for a powerless slap hitter with great speed…totally…
Romero Getting That Sinking Feeling…
At first I was excited to learn that Romero is using pitch f/x information to diagnose his 2012 woes, but that passed quickly to outrage at the fact that it was provided in the form of printouts from Brooksbaseball by Brandon freaking Morrow. It continues to flabbergast me that teams show basically no interest in applying modern technology and analysis to get the most out of their multi-million-dollar investments on the field.
Romero is obviously open to and interesting in using this type of information, and the pitch f/x system takes an incredibly detailed picture of every pitch he throws. Yet, it takes a combination of internet hobbyists and a fellow pitcher taking the initiative for such stunningly useful and freely-available information to make its way to Romero, so he can be “amazed” by it. Le sigh. With apologies to Archimedes: give me a laptop and a place to stand in the dugout, and I will change your WAR!
Because yeah…in my not-so-humble opinion, Morrow botched the analysis (although obviously a standing ovation for him doing anything at all). When you look at more of Romero’s career than just the last two seasons, there is just no way to come to the conclusion that the key to Romero’s struggles is a lack of sinkers. He threw considerably more sinkers to RHB in 2012 (19.3%) than he did in 2010 (14%), and almost as many (16.1 compared to 17.5) to LHB. It was a mix that worked for him fine two (and three) years ago, not something that changed before the debacle that was Romero’s 2012 season.
***Note*** It’s up for debate/kind of arbitrary where your pitch-classifying algorithm draws the line between fastball and 2-seamer/sinker, as there is overlap in terms of movement as well as velocity. The way I split them, it’s a much more modest overall drop than Brooks’ numbers in terms of 2-seamers anyway, from 25% to 18% between 2012 and 2011. Here are a couple of graphs of pitch f/x ‘movement’ to give you an idea of the blurring between the two offerings, and because my contract stipulates I have to include at least one (x,y) chart per article:


The real reason for there appearing to be a sudden drop is that Romero’s sinker use soared in 2011, most likely to compensate for his AWOL changeup. As I argued at some statistical length a while back, everything else about Romero’s repetoire pales in comparison to the fact that his change now moves like a completely different pitch, with almost 6 (!!) inches more drop than average. But, with that transformation it has turned from being his primary offspeed pitch (and a great one at that) to hittable trash that he is quite rightly completely unwilling to throw to lefties.
Unless Ricky is trying to redefine himself as a true sinkerballer, the 26% of 2-seamers he threw in 2011 is very high, not some kind of career norm that he needs to return to in order to find his old levels of success. The one good thing about Romero’s sinker comments was that he seemed to be willing to throw it for strikes and let it be put in play. The percentage of Romero’s 2-seamers that were located in the zone fell to an ludicrous 34% last season, so concentrating on pounding the zone with it in spring training can’t hurt. Romero certainly should be getting more strikes and grounders by throwing it to contact instead of as a chase pitch — but he’ll never be the Ricky of old without his changeup.
Follow-up on Josh Johnson’s Curveball
I probably would have done more of this if I wasn’t completely statistically gassed by the time the fact that Josh Johnson even HAD a curveball rolled around. But as pointed out in the comment, any excitement over a new pitch has to be tempered by the fact that it won’t be a novelty for long. Only time will really tell, but here’s a look at the evolution of JJ’s new pitch as the year progressed:
1a) Movement — Side-to-side (pfx)

Pfx is where the ball ended up along the horizontal plane compared to where it would have without spin, in inches. Clearly, there is a lot of variation from one pitch to the next but also a downward trend, which means the pitch moved less from right to left as the season went on. Also, there was less spread, which is most likely a sign of increased consistency from JJ. His first 200 curveballs had a standard deviation of 1.93, and his last 230 were at 1.79 (to try to get at what that means in baseball terms would be stupid).
Also, see that patch right over the 200 mark where every single curve is below 4? That corresponds to July 4-18, 3 starts where JJ got shelled in an otherwise excellent stretch.
1b) Movement — Up-down (pfz)

I took the liberty of splitting these pitches up by start to address the elephant in the room — right in the middle of those three crappy starts mentioned above, Josh Johnson’s curveball dropped an extra half foot for one start (immediately after the All-star game, incidentally). Then for the rest of the season, the ‘drop’ on his curve steadily decreased. Experimenting with a new grip? Broken nail? Craft your own narrative…
1c) Movement — Bend (break_length)
 Looks like an increasing amount of ‘bend’ early in the season, then a shaky patch around the all-star break, and a downward trend at the end of the season. The single start highlighted in red is his August 25 start, which was his one other blowup of the year after the break. For some reason leading into that start his curveball started to flatten out, and then was atrocious as the Dodgers pounded him for 10 hits and six runs through three innings.
I’m not trying to imply that it was all due to his curveball, but I find it really cool that there are usually completely obvious reasons for a sucky start rather than all the hocus-pocus about ‘not being sharp’, or ‘leaving a few pitches up’ we hear. I mean, of COURSE he’s not going to spill the beans on national TV after the game, but you know JJ was thinking ‘what the heck is wrong with my curveball, we gotta get on that’ after that game. Someday, every pitcher will get post-game reports like this, as umpires do (did?) with QUESTEC.
2a) Results — Miss %

What I did here was plot for every swing whether the result was a hit or miss, and then run a rolling average (series=15). So apparently the league started to make more contact against JJ’s curve after a certain point
2b) Results — Hits

Same thing, with hits/balls put in play. Sample size is starting to become an issue, but that’s a very clear spike in the middle of the season.
2c) Results — In Zone %

2d) Results — Chase out of zone

Just including these to be complete…nothing really pops out as conclusive for me.
TAKEAWAYS:
- Johnson tightened up his Curve into more of a pure 12-6 as the season went on.
- He was getting more and more drop on it until the all-star break, when something went horribly wrong. From then on, that trend reversed.
- It was getting more and more ‘loopy’ until late in the season, when again, after a terrible start, things started moving in the opposite direction.
- The league was more and more able to make contact with his curve as the season went on.
- This lead to more and more hits coming against it until the midway mark, at which point, yep, things reversed dramatically.
Lumping all this together, I would say that Johnson was working on making his curve more and more nasty as the league was catching up to it, and then somewhere around the mid-way point (possibly spurred on by it falling apart) wisely switched his focus to making it more controllable so he could place it more effectively. But that might be just because I know that’s what happens to every rookie pitcher and it makes sense that it would for a veteran with a new toy…
3ai) Random — average # of Strikes in count when throwing curveball

Just a cute, not-particularly-scientific way of seeing if he was throwing it more often later in the count, i.e. a punchout pitch, as the year went on. Yep. With one crazy stretch where he gave up on it. Doing the same thing for this slider suggests that he went back to using his slider later in the count after the break:
3aii) SLIDER — average # of Strikes in count when throwing slider

Annnnnd I’ll just bury at the very bottom of another long post a semi-apology to Bot Elliott after he clarified the Johnson #3 comment during in his online chat with: “Right now they have a lot of No. 3s or maybe Morrow is a No. 2 and Johnson could be if his shoulder allows him to add missing MPH”. That is without a doubt the most informed reason for saying that, although I still think it’s quite the bombshell to drop without any context or attempt to back it up.
Update: Ok, I take that back. Random comments from mystery men at the winter meetings is just not compelling journalism. YOU’RE IN THE HALL OF FAME, BOB. Have an opinion! Say something! Don’t just pass on this scuttlebutt like it’s this incredible inside information but you just…can’t…give up your source. Putting together that Lawrie runs and Gibby is a red light did not exactly require Deepthroat in the parkinglot, y’know?
Pitch f/x — Under the Hood with Josh Johnson
May as well start this monster of a post off with a bang and slag a Hall-of-Fame baseball writer: has anyone else noticed that Bob Elliott constantly spices up his articles with highly-controversial statements from ‘veteran evaluators’ who sound a lot more like they’re coming from an old Blue Jays fan, or maybe, you know, himself, than they do anything that a real scout would say? From today’s Sun:
“I like the trade, I like Buehrle and Johnson, but they’re a couple of No. 3s for me,” said one veteran evaluator. If you’re going for it — and it appears by everything they’ve done to date, that they are — they need someone else.”
“They really don’t have a dominant No. 1, a Dave Stieb, Jack Morris, Juan Guzman, Pat Hentgen or Roy Halladay.”
While I’m also of the mind that the Jays’ rotation has not been solidified this offseason as much as most people think, calling Josh Johnson a third starter (whatever that means, anyway) demands an explanation. The only way that statement makes any sense at all is if you think he now has diminished stuff due to his arm injuries, know nothing about him except his ERA last year, or are making argument that a #1 who is injured half the time is the same thing as a #3.
Because after labouring through the first two months of last season (really his first six starts — remember that number!) Johnson essentially returned to his career numbers, which made him the clear #1 the Blue Jays were counting on when they made the trade (although he might not be quite at the dizzying heights of *snort*Jack Morris during his time with the Jays, or *chortle* Juan Guzman). With such a history of arm problems, Johnson could equally well boom or best — but there’s no reason to think he has settled into Buehrle-style solid mediocrity.
Anyway, we just have to trust that the Jays are still haunted by the name Mike Sirotka and have done their due diligence up the wazoo about his physical state…but let’s look at what pitch f/x has to say about Johnson’s 2013 and his prospects going forward. To begin, here’s how the man himself saw his 2012 season:
“I’d say maybe the last 15 starts, I felt so much better than before,” Johnson said. “I was kind of fighting myself, fighting my body, trying to do this or that, maybe trying to find a little bit more velocity. But once I relaxed and just trusted myself, it just kind of came out.
“I don’t know if I was throwing any harder or anything like that. But you could tell with the depth that I had on my slider and my curve ball, and the location of my fastball got much, much better.”
1. Fastball
It’s the “trying to find a little bit more velocity” that pops out for me here, because if we isolate his four-seam fastball, that is indeed the case. Trust me for one second here — basically every healthy mature pitcher sees his velocity subtly but steadily increase throughout the season. But Johnson’s average fastball velocity flew up over the first couple of months, and then declined for the rest of the season as he became more effective.

[Edit: Ok, that’s a little Mickey Mouse so here’s pitch-by-pitch instead of game-by-game, with a rolling average of 5 in black that drops about 3mph through the heart of the season]

Things start to look really scary when you compare his velocity to his previous years. Even at his peak in 2012, Johnson was only back up to where he was in 2011 before he got injured, and then went in the wrong direction (the start of 2009 is missing in the following graph because pitch f/x wasn’t entirely set up yet).

If that doesn’t scare you, it should. As soon as a power pitcher known for his 95 mph heater and a killer slider starts talking about ‘hitting his spots’ and not being concerned about his velocity…run. Anyone remember B.J. Ryan? Seem Tim Lincecum lately? You can talk heart and location and pitching all day but strikeouts matter. And unless you’re a control pitcher to begin with, losing 2-3 mph on your fastball without anything to compensate for it is obviously going to affect your K rate in some way.
But wait…all is not lost, because for some reason last season Johnson’s K numbers DID steadily progress to the point where they were right in line with his old self.

So what gives? Did he find exceptional control at the expense of velocity? I don’t think so. Here’s how often his fastball was thrown in the zone as the season went on:

Obviously being in the zone is not the final word on fastball control, so let’s try another stat that I made up — the % of pitches that were “paint”, i.e. within a few (in this case, 2) inches of the border of the strike zone. I know, I know…I’m lumping in 3-0 fastballs with pitches that actually matter, but it’s not like Johnson became some control artist on the outer half when he started backing off on his velocity — if anything, other that a few crazy games late in the season, he was throwing less paint than when he was trying to throw his fastball harder.

[Edit: I take that back. If you take a rolling average of paint pitch-by-pitch, it does show a minor improvement in his ability to paint over the season, with low stretches in April and July when he was getting shelled.]

Enough charts, time for a table! In pitch f/x terms, “Breaklength” is the maximum distance a pitch deviates from a straight line from hand to glove. I think of it as the size of the ‘bend’ in a fastball, or the ‘loop’ in a Curve. ‘Pfz’ is how much a pitch resists the pull of gravity, and correlates to the ‘explosiveness’, ‘hop’, ‘giddy-up’, or whatever you want to call how much a 4-seamer seems to ‘rise’.
| Josh Johnson’s 4-Seam Fastball | ||||||
| Year | MPH | Breaklength | Pfz | In Zone % | Miss % | On Fringe% |
| 2009 | 95.04 | 3.25 | 10.05 | 50 | 31 | 19 |
| 2010 | 94.73 | 3.27 | 9.90 | 49 | 40 | 21 |
| 2011 | 93.81 | 3.76 | 8.95 | 58 | 23 | 22 |
| 2012 | 92.77 | 3.91 | 8.45 | 52 | 18 | 21 |
Again, scary stuff. Johnson has lost an inch and a half of fastball ‘hop’ and batters are swinging through his fastball half as often as they did a couple of years ago. You can make the argument that he is moving towards a more accurate, moving fastball, but that does sound a lot more like a decent number three than the top-of-the-rotation stalwart the Jays need.
2. Slider
Ok, onto the next part of his self-evaluation — did his breaking stuff show improved ‘depth’ and pick up the K-slack?
First let’s look at his signature pitch, the slider. Unfortunately, results against a single off-speed pitch can be highly deceiving because so much is based on context. If you have lost fastball control, it might look like your slider has fallen apart, because you never get to throw it in 2-strike counts where a hitter has to defend the plate. Or, if your fastball velocity is down, guys don’t have to cheat to catch up to it so they don’t bite early on your slider.
But anyway, the graphs below are my case that although he did manage to locate his slider where it belongs out of the zone more often, it wasn’t any more effective in terms of swings-and-misses. Opposing batters got far fewer hits off it, but I think that equates to fewer hung sliders, and not ‘increased depth’ that would help with punchouts. Swing and miss rates correlate directly to K% (without the fluctuation, basically), and for Johnson’s slider they actually declined in the second half last year.

Compared to previous seasons, here’s how his slider matches up:
| Josh Johnson’s Slider | ||||||
| Year | MPH | Breaklength | PFX | PFZ | Miss % | In Zone |
| 2009 | 87.55 | 7.31 | 2.15 | 2.07 | 48 | 45 |
| 2010 | 87.86 | 7.07 | 2.45 | 2.69 | 46 | 44 |
| 2011 | 85.82 | 8.06 | 2.69 | 1.09 | 52 | 23 |
| 2012 | 86.91 | 7.37 | 2.45 | 1.68 | 53 | 29 |
The PFX/PFZ numbers are interesting — he has traded about a half-inch of sideways movement for a half-inch of drop. As I manage to work into every single post these days, that seems to be a bad thing. Sliders seem to be more effective when they cut straight sideways instead of sinking and bending, more like a cutter than a curveball.
And that seems to have an effect on how he is using it — as a chase pitch rather than a hard-to-hit potential strike. While the overall miss % has risen, that’s only because the number of them thrown in the strike zone has plummeted (@#$@#$ context!). Taking only sliders that were thrown for strikes, Johnson’s Miss % has fallen sharply: 27%/26%/14%/21%. While he is using it in a more conventionally recommended way, it is not as fast, not as hard, not as nasty. And he seems to know it.
3. Curveball
I hope you’re ready for some good news, because I sure as hell was at this point. Since Johnson only really started throwing it last year, there’s not a lot to compare Johnson’s curve to, but here we go:
| Josh Johnson’s Curve | ||||||
| Year | MPH | Breaklength | PFX | PFZ | Miss % | In Zone |
| 2011 | 77.71 | 12.46 | 5.17 | -5.65 | 14 | 34 |
| 2012 | 78.43 | 12.01 | 4.48 | -5.20 | 42 | 36 |
A 42% miss % on a curve is pretty darn good for a third pitch. Even in 2011, just having it lead Chipper Jones to remark: “Oh, OK, he’s got a curveball now…I hope he doesn’t throw that too many more times.”
But now the kicker — here’s Johnson’s K’s per game in 2012 broken down by pitch type:
 See the flatline over the first six starts on his curve, after which point it was just as important a strikeout pitch as his slider? Yeah, having an 6.61 ERA and a .359 BAVG against might lead you to trying something new…now take a look at the % of curveballs Johnson threw as the season progressed:

AHA! So THAT’S how he managed to keep his K’s up when all of his other pitches seem to be less effective. I know these graphs are ugly and unscientific, but there’s more to the story than him throwing his curveball 14% of the time or whatever it was over the entire year. What started as a completely non-existent offering was making up more than 20% of his pitches by the end of the year. That’s ridiculously high — Buehrle has a nice floater, and he threw it 11% of the time last year. Gio Gonzalez uses it as his only breaking pitch and he’s only at 21%.
Josh Johnson used to be able to get away with throwing two plus-plus pitches and a show-me change. After a series of arm problems, he’s just not that dominating power pitcher any more. Half a dozen starts into last season, that became obvious to him and/or his coaches, and he started using a pitch in strikeout situations that he had only tinkered with in the past. It worked amazingly well for him, and he started to get more and more confidence with it as the season went on until he was just as effective as he used to be when his repertoire was much more nasty, but predictable. It saved his year, and possibly his career — and what we get to see in Toronto is the first complete season of him with a full repertoire. Excited again?
POSTSCRIPT: Ok, I’ve been really sick the last few days so I didn’t even read the rest of the quotes from Johnson where he talked to the media about his curve, hence why I’m so excited to have ‘stumbled’ upon the fact that it was a revelation last year. It sounds like John Buck might have been the one to recognize it as a plus offering and prod him into throwing it more and more as the season went on:
This was my first full season to pitch with it and to throw it that much. I was learning the whole year. Good thing I had John Buck back there because he helped me out tremendously. Whenever I was in doubt he would put it down, kind of gave me that re-assurance that this is the right pitch, let’s throw it. So I could (learn) how to throw it and when, where to throw it, things like that.